

Monit ist ein leicht einzurichtendes, ressourcenschonendes und Battle-getestetes Open-Source (AGPLv3) Programm, das sich Herr Vorragend als Monitoring- und Management-Lösung für Unix-Systeme eignet.
Einmal (oder wer auch mag zweimal) eingerichtet, kann Monit eine Vielzahl von Serverdiensten überwachen, einschließlich Filesystem, CPU, Speicher, Logfiles, Datei/Ordner-Veränderungen und verschiedene Protokolle wie HTTP, SMTP, FTP, LDAP, NTP, SSH, SIP, IMAP, POP, DNS usw.
Wenn z.B ein Servicedienst (Webserver, Datenbank, etc.) abkackt oder dirty Veränderungen an zu überwachenden Dateien (md5, sha1) vorgenommen werden, löst Monit einen Alarm aus (Email,Webhooks, Slack, etc.), startet den Service neu und eine verpetzende E-Mail-Benachrichtigung wird verschickt.
Ansicht – Monit Status Webinterface
Das mitgelieferte Webinterface zeigt super quick einen Überblick über das System.
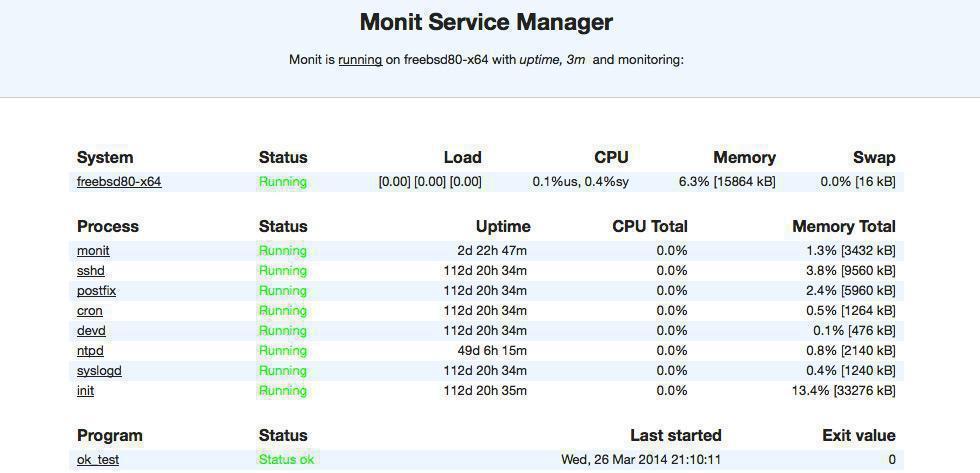
Hier gibts ne juicy Anleitung/Howto zur Installation, Konfiguration von Monit plus ein paar Beispiel-Konfigurationen für Debian-basierte Root-Server.
Monit installieren
apt-get update && apt-get install monit
systemctl enable monit
Monit Einrichten
# Ordner for die Eventqueues anlegen und Berechtigung setzen
install -d -o monit -g monit -m 750 /var/monit

# /etc/monit/monitrc absichern
chown root:root /etc/monit/monitrc
chmod 600 /etc/monit/monitrc
# /etc/monit/monitrc
# Ereigniswarteschlange allows Ereignisse (hier 1000) zu speichern, schrittweise abzuarbeiten plus hilft auch keine Events zu verlieren
set eventqueue basedir /var/monit/ slots 1000

# Überprüfungsintervall in Sekunden setzen. Hier Alle zwei Minuten check
set daemon 120
    with start delay 240

# Monit Logfile setzen
set logfile /var/log/monit.log

# E-Mail-Server-Konfiguration für Benachrichtigungen
set mailserver 127.0.0.1
set mail-format {
    from: monit@$HOST
    subject: monit alert -- $SERVICE $EVENT am $DATE
    message: $EVENT Service $SERVICE
            Date:        $DATE
            Action:      $ACTION
            Host:        $HOST
            Description: $DESCRIPTION

            Dein geiler True OG Admin!
}

# Do not alert when Monit start, stop or perform a user initiated action
set alert $DEINE_EMPFANGS_MAIL not on { instance, action }

# Konfiguration für Status-Anzeige & Webinterface
set httpd port 2812 and
    use address localhost
    allow localhost
    allow $BENUTZER:$STABILES_PASSWORT

# Konfigurationen einbinden
include /etc/monit/conf.d/*.cfg
include /etc/monit/conf-enabled/*
Monit Service-Konfigurationsdatei Beispiele
Systemressourcen Monitoring
# /etc/monit/conf.d/system.cfg

# Monitoring Systemressourcen
check system $HOST

  # Monitoring CPU-Auslastung
  if cpu usage (user) > 85% for 3 cycles then exec "/root/server-scripts/sys-monit-top-process.sh"
  if cpu usage (system) > 35% for 3 cycles then exec "/root/server-scripts/sys-monit-top-process.sh"
  if cpu usage (wait) > 20% for 3 cycles then exec "/root/server-scripts/sys-monit-top-process.sh"
  if cpu usage > 200% for 3 cycles then exec "/root/server-scripts/sys-monit-top-process.sh"

  # Monitoring Load Average
  if loadavg (1min) > 6 for 3 cycles then exec "/root/server-scripts/sys-monit-top-process.sh"
  if loadavg (5min) > 4 for 3 cycles then exec "/root/server-scripts/sys-monit-top-process.sh"

  # Monitoring RAM-Verbrauch
  if memory usage > 85% for 3 cycles then exec "/root/server-scripts/sys-monit-top-process.sh"
  if swap usage > 30% for 3 cycles then exec "/root/server-scripts/sys-monit-top-process.sh"

  # Checks gruppieren
  group system
Monit Skript sys-monit-top-processes.sh
#!/usr/bin/env bash
#==========================================================
# Script Name:        sys-monit-top-processes.sh
# Script Path:        /root/server-scripts/
# Autor:              Hackspoiler
# URL:                https://hackspoiler.de
# Version:            0.9
# Git Repository:     https://codeberg.org/hackspoiler/root/src/branch/main/linux/services/monit/sys-monit-top-processes.sh
# Date Created:       16.05.2019
# Date Modified:      28.06.2026
# Usage:              /root/server-scripts/sys-monit-top-processes.sh
# Description:        Monit Skript das bei Alerts den Hostname, die Load Average und die Top 10 CPU/RAM-Verschwender verpetzt
# Dependencies:       mail ps awk hostname
# License:            MIT
#==========================================================

#==========================================================
# Set Bash-Defaults
#==========================================================
set -o errexit  # Beenden, falls ein Befehl abkackt (-e)
set -o nounset  # Beenden, falls ungesetzte Variable existiert (-u)
set -o pipefail # Beenden, falls eine Pipeline abkackt

# Set permission
umask 077

# Set PATH
PATH='/usr/local/sbin:/usr/local/bin:/usr/sbin:/usr/bin:/sbin:/bin'
export PATH

#==========================================================
# Les Variables
#==========================================================
readonly DOMAIN_NAME="${DOMAIN_NAME:-hackspoiler.de}"
readonly EMAIL_ADDRESS="server@${DOMAIN_NAME}"

#==========================================================
# Functions
#==========================================================
# Function - Check needed commands
require_commands() {
  local command_name

  for command_name in "$@"; do
    command -v "${command_name}" >/dev/null 2>&1 || {
      printf 'Fehler: Befehl "%s" wurde nix gefinden.\n' "${command_name}" >&2
      exit 1
    }
  done
}

# Function - Send Email-Report
send_report() {
  local hostname
  local load_average
  local cpu_output
  local mem_output
  local subject

  hostname="$(hostname --fqdn 2>/dev/null || hostname)"
  subject="Top Prozesse auf ${hostname}"

  load_average="$(awk '{print $1, $2, $3}' /proc/loadavg)"

  cpu_output="$(
    ps -eo pid,ppid,user,pcpu,pmem,stat,etime,args --sort=-pcpu |
      awk 'NR <= 11'
  )"

  mem_output="$(
    ps -eo pid,ppid,user,pcpu,pmem,stat,etime,args --sort=-pmem |
      awk 'NR <= 11'
  )"

  {
    printf '# Systemname\n%s\n\n' "${hostname}"
    printf '# Load Average des Systems\n%s\n\n' "${load_average}"
    printf '# Top 10 Prozesse nach CPU-Auslastung\n%s\n\n' "${cpu_output}"
    printf '# Top 10 Prozesse nach Speicherverbrauch\n%s\n' "${mem_output}"
  } | mail -s "${subject}" "${EMAIL_ADDRESS}"
}

#==========================================================
# Call der dirty functions
#==========================================================
main() {
  require_commands mail ps awk hostname
  send_report
}
main
Festplattenspeicher Monitoring
# /etc/monit/conf.d/disk.cfg

# Monitoring /boot auf HDD /dev/sda1
check filesystem boot with path /dev/sda1
  if space usage > 85% for 3 cycles then exec "/root/server-scripts/sys-monit-disk.sh"
  if inode usage > 90% for 3 cycles then exec "/root/server-scripts/sys-monit-disk.sh"

# Monitoring (/) auf HDD /dev/mapper/root
check filesystem root with path /dev/mapper/root
  if space usage > 90% for 3 cycles then exec "/root/server-scripts/sys-monit-disk.sh"
  if inode usage > 90% for 3 cycles then exec "/root/server-scripts/sys-monit-disk.sh"

# Monitoring /var auf HDD /dev/mapper/var
check filesystem var with path /dev/mapper/var
  if space usage > 90% for 3 cycles then exec "/root/server-scripts/sys-monit-disk.sh"
  if inode usage > 90% for 3 cycles then exec "/root/server-scripts/sys-monit-disk.sh"

# Monitoring /home auf HDD /dev/mapper/home
check filesystem home with path /dev/mapper/home
  if space usage > 90% for 3 cycles then exec "/root/server-scripts/sys-monit-disk.sh"
  if inode usage > 90% for 3 cycles then exec "/root/server-scripts/sys-monit-disk.sh"

# Checks gruppieren
group disk
Monit Skript sys-monit-disk.sh
#!/usr/bin/env bash
#==========================================================
# Autor:          Hackspoiler
# URL:            https://hackspoiler.de
# Scriptname:     sys-monit-disk.sh
# Scriptpath:     /root/server-scripts/
# Usage:          /root/server-scripts/sys-monit-disk.sh
# Version:        0.5
# Date:           16.02.2022
# Shellcheck:     True
# Package:        mail
# Modification:   12.05.2023
# Descritpion:    Monit Skript das bei Alerts den Hostname, die Festplattenbelegung plus Inodes verpetzt
#==========================================================

# Set Bash-Defaults
#==========================================================
set -o errexit  # Beenden, falls ein Befehl fehlschlägt (-e)
set -o nounset  # Beenden, falls ungesetzte Variable exisitiert (-u)
set -o pipefail # Beenden, falls eine Pipeline fehlschlägt

# Set Variables
#==========================================================
EMAIL_SUBJECT="Oversicht Festplattenbelegung und Inodes"
EMAIL_ADDRESS="$DEINE_ZIEL_EMAIL"

# Main
#==========================================================

# Systeminformationen
FQDN=$(hostname --fqdn)

# Festplattenbelegung und Inodes
DISK_USAGE=$(df --human-readable --exclude-type tmpfs --exclude-type devtmpfs | sort --key 2 --reverse)
INODE_USAGE=$(df --inodes --human-readable --exclude-type tmpfs --exclude-type devtmpfs | sort --key 2 --reverse)

# Email-Inhalt
EMAIL_BODY="# FQDN des Systems
${FQDN}

# Festplattenbelegung:
${DISK_USAGE}

# Inode-Nutzung:
${INODE_USAGE}"

# Emailversand
echo -e "${EMAIL_BODY}" | mail -s "${EMAIL_SUBJECT}" "${EMAIL_ADDRESS}"
Logfile Monitoring
# /etc/monit/conf.d/logfile.cfg

# Monitoring Syslog-Dienst
check process rsyslog with pidfile /run/rsyslogd.pid

 # Start/Stop Befehl für den Dienst
  start program = "/usr/bin/systemctl start rsyslog"
  stop program  = "/usr/bin/systemctl stop rsyslog"

  # Nach 5 fehlgeschlagenen Restart-Versuchen deaktivieren
  if 5 restarts within 5 cycles then timeout

  # Gruppierung von Checks
  group logfile

# Monitoring der Syslog-Protokolldatei
check file syslog with path /var/log/syslog
  if match "error|panic|Killed" then alert

  # Check ob Logfile seit 3 Minuten nicht mehr aktualisiert wurde
  if timestamp > 3 minute then alert

  # Check ob Logfile over 30MB groß ist
  if size > 30 MB then alert

  # Gruppierung von Checks
  group logfile

# Monitoring der Kernen-Log-Protokolldatei
check file kernlog with path /var/log/kern.log
  if match "error|panic|Killed" then alert

  # Check ob Logfile over 30MB groß ist
  if size > 30 MB then alert

  # Gruppierung von Checks
  group logfile
Fail2ban Monitoring
# Check des Fail2ban-Prozess
check process fail2ban with pidfile /var/run/fail2ban/fail2ban.pid

  # Start/Stop Befehl für den Dienst
  start program = "/bin/systemctl start fail2ban"
  stop program = "/bin/systemctl stop fail2ban"

  # Check des Fail2ban-Sockets
  if failed unixsocket /run/fail2ban/fail2ban.sock protocol fail2ban then restart

  # Nach 5 fehlgeschlagenen Restart-Versuchen deaktivieren
  if 5 restarts within 5 cycles then timeout

  # Gruppierung der Checks
  group fail2ban

# Check des Fail2ban-Logfile
check file fail2ban-log with path /var/log/fail2ban.log

  # Wenn nicht vorhanden dann heulen
  if does not exist then alert

  # Gruppierung der Checks
  group fail2ban
Apache Webserver Monitoring
# /etc/monit/conf.d/apache.cfg
# Monitoring des Apache-Webserver
check process apache with pidfile /var/run/apache2/apache2.pid

  # Start/Stop Befehl für den Dienst
  start program = "/bin/systemctl start apache2"
  stop program = "/bin/systemctl stop apache2"

  # Monitoring der Apache-Child-Prozesse
  if children > 250 for 3 cycles then exec "/root/server-scripts/sys-monit-top-process.sh"
  if children > 300 for 2 cycles then restart

  # Lokaler Apache-Check
  if failed
      host 127.0.0.1
      port 443
      type tcpssl
      protocol http
      request "/"
      status = 200
      timeout 10 seconds
      for 3 cycles
  then restart

  # Externer Apache-Check over se Domain hackspoiler.de auf Port 443
  if failed
      host hackspoiler.de
      port 443
      type tcpssl
      protocol http
      request "/"
      status = 200
      timeout 10 seconds
      for 3 cycles
  then alert

  # Nach 5 fehlgeschlagenen Restart-Versuchen Apache timeouten
  if 5 restarts within 5 cycles then timeout

  # Checks gruppieren
  group webserver
Mysql Datenbank Monitoring
# /etc/monit/conf.d/mysql.cfg

# Monitoring der Mysql Datenbank
check process mysqld with pidfile /var/run/mysqld/mysqld.pid

  # Start/Stop Befehl für den Dienst
  start program = "/bin/systemctl start mysql"
  stop program = "/bin/systemctl stop mysql"

  # Monitoring der IP 127.0.0.1 auf Port 3306
  if failed host 127.0.0.1 port 3306 protocol mysql then restart

  # Nach 5 fehlgeschlagenen Restart-Versuchen Mysql timeouten
  if 5 restarts within 5 cycles then timeout

  # Checks gruppieren
  group dbserver
NFS-Freigabe Monitoring
# /etc/monit/conf.d/nfs-mount.cfg

# Monitoring der Borgbackup NFS-Freigabe
check filesystem nfs-share with path /mnt/backup/borg
    if not mounted then exec "/usr/bin/timeout 15 /usr/bin/mount /mnt/backup/borg"

# Schreibtest auf Borgbackup NFS-Freigabe
check program nfs-write with path "/root/server-scripts/sys-monit-check-nfs-write.sh"
    timeout 15 seconds
    if status != 0 then alert

# Checks gruppieren
group nfs-mount
Monit Skript sys-monit-check-nfs-write.sh
#!/usr/bin/env bash
#==========================================================
# Autor:          Hackspoiler
# URL:            https://hackspoiler.de
# Scriptname:     sys-monit-check-nfs-write.sh
# Scriptpath:     /root/server-scripts/
# Usage:          /root/server-scripts/sys-monit-check-nfs-write.sh
# Version:        0.5
# Date:           09.03.2023
# Shellcheck:     True
# Package:
# Modification:   22.04.2023
# Descritpion:    Monit Skript um Schreibzugriff auf den NFS-Mount zu checken
#==========================================================

# Variable
TEST_FILE="/mnt/backup/borg/sys-monit-check-nfs-write"

# Schreibversuch auf NFS-Freigabe
touch "${TEST_FILE}"

if [[ ${?} -eq 0 ]]; then
    rm --preserve-root "${TEST_FILE}"
    exit 0
else
    exit 1
fi
Monit überprüfen und Dienstservices starten
Monit Konfiguration testen
monit -t
Wenn keine Fehler angezeigt werden
systemctl restart monit
Überwachung eines Services aktivieren
Wenn ein Dienst nach einem Restart nicht automatisch aktiviert wird
# Status anzeigen lassen
monit status

# Beispielausgabe mysql
Process 'mysql'
  status                       Not monitored
  monitoring status            Not monitored

# Monitoring aktivieren
monit monitor mysql

# Restarten und nocheinmal gegechecken
systemctl restart monit
monit monitor mysql

# Beispielausgabe mysql
Process 'mysql'
  monitoring status            Monitored
  monitoring mode              active
GeMONITorte Prozesse auflisten
Zeigt alle laufenden Prozesse die Monit mit dem übergebenem RegEx-Ausdruck findet:
# Syntax
monit procmatch $REGEX

monit procmatch mysql
List of processes matching pattern "mysql":
┌───┬───────┬───────┬────────────────────────────────────────────────────────────────┐
│   │ PID   │ PPID  │ Command                                                        │
├───┼───────┼───────┼────────────────────────────────────────────────────────────────┤
│ * │ 22825 │     1 │ /usr/sbin/mysqld --daemonize --pid-file=/run/mysqld/mysqld.pid │
└───┴───────┴───────┴────────────────────────────────────────────────────────────────┘
Total matches: 1

Online RegEx Tester: https://regex101.com/
Monit Status anzeigen
# Nur wenn Webschnittstelle aktiv ist
monit status
monit status $DIENST

monit summary
┌─────────────────────────────────┬────────────────────────────┬───────────────┐
│ Service Name                    │ Status                     │ Type          │
├─────────────────────────────────┼────────────────────────────┼───────────────┤
│ tron                            │ OK                         │ System        │
├─────────────────────────────────┼────────────────────────────┼───────────────┤
│ mysql                           │ OK                         │ Process       │
├─────────────────────────────────┼────────────────────────────┼───────────────┤
│ apache                          │ OK                         │ Process       │
├─────────────────────────────────┼────────────────────────────┼───────────────┤
│ boot                            │ OK                         │ Filesystem    │
├─────────────────────────────────┼────────────────────────────┼───────────────┤
│ root                            │ OK                         │ Filesystem    │
├─────────────────────────────────┼────────────────────────────┼───────────────┤
│ var                             │ OK                         │ Filesystem    │
├─────────────────────────────────┼────────────────────────────┼───────────────┤
│ srv                             │ OK                         │ Filesystem    │
└─────────────────────────────────┴────────────────────────────┴───────────────┘
Überwachung eines Services stoppen
# Status anzeigen lassen
monit status

# Beispielausgabe mysql
Process 'mysql'
  monitoring status            Monitored
  monitoring mode              active

# Monitoring stoppen
monit unmonitor mysql
Monit Logfile
# Logile anzeigen
tail -f /var/log/monit.log